
Organizations that invest in professional business intelligence services are 5× more likely to make faster decisions than their competitors and 3× more likely to exceed their revenue targets. Yet most companies are still relying on static spreadsheets, siloed reports, and delayed data to run multi-million-dollar operations. That gap is exactly where TheCoderBox delivers value.
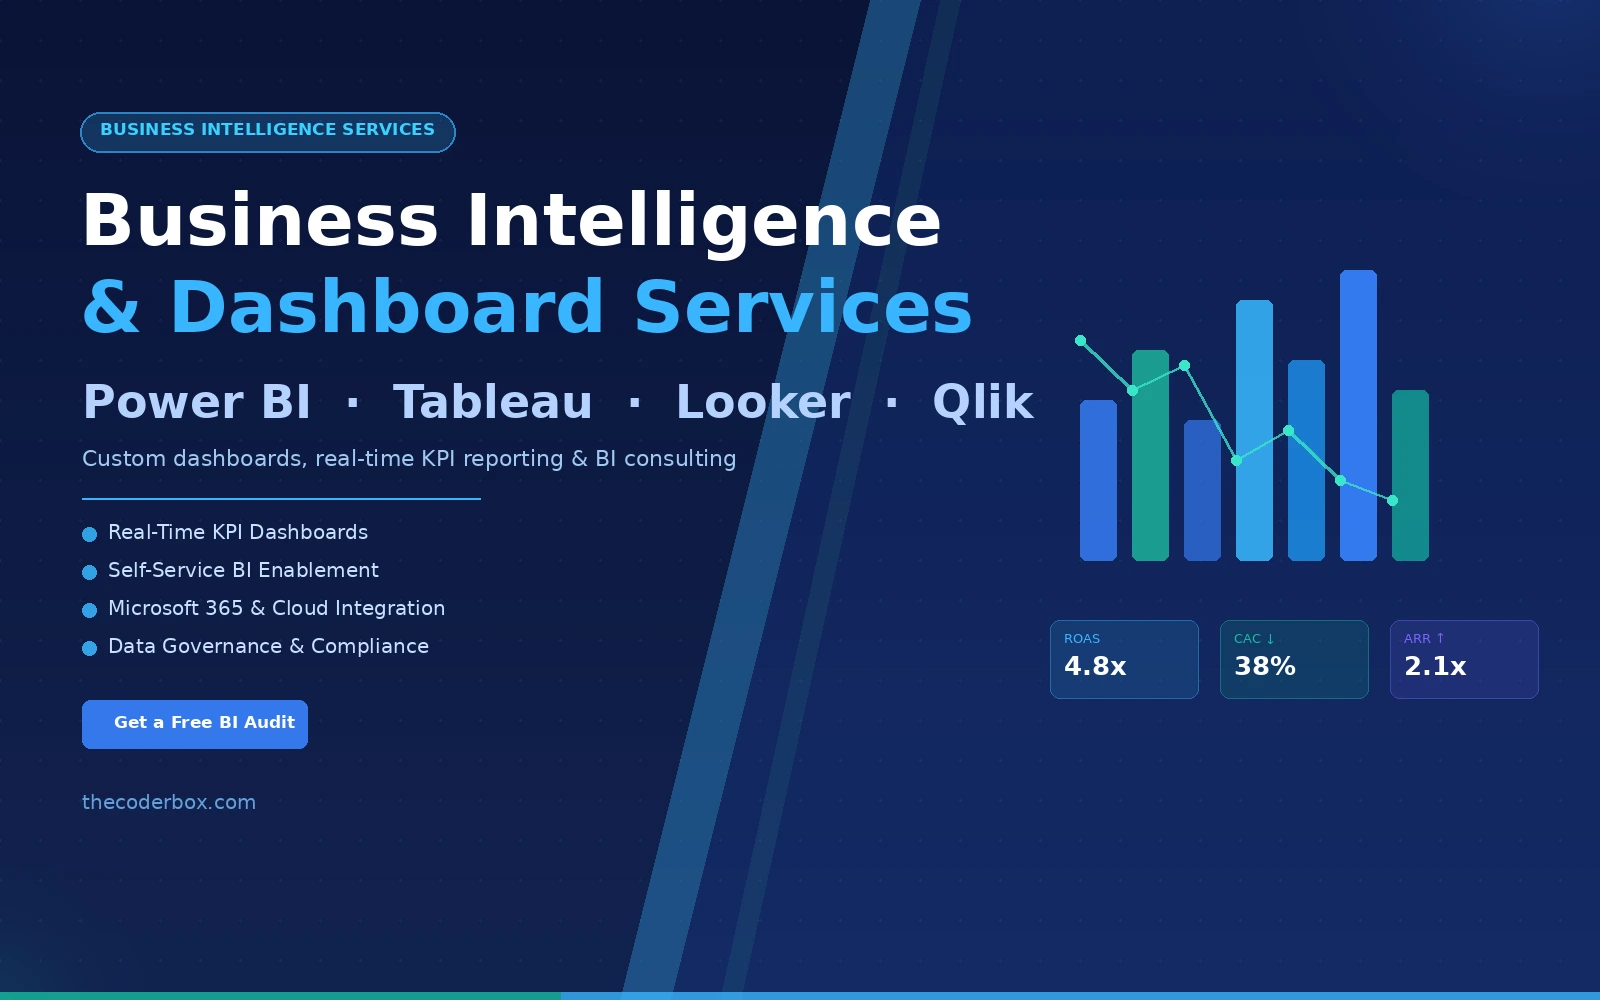
Our data analytics services include end-to-end business intelligence services spanning custom dashboard development, real-time KPI reporting, self-service BI enablement, and full-stack data visualization services powered by Power BI, Tableau, Looker, and Qlik. Whether you are a finance director who needs live cash flow dashboards or a CMO tracking ROAS across 12 marketing channels, our BI dashboard development services turn raw data into revenue.
Book a free consultation today
What Are Business Intelligence Services?
Business intelligence services encompass the full spectrum of technologies, processes, and consulting engagements that help organizations collect, transform, and visualize operational data into actionable insights. Unlike traditional reporting which answers ‘what happened last quarter’ modern BI platforms deliver real-time reporting on live operational metrics, enabling decisions in minutes rather than weeks.
The difference between a company operating on intuition and one powered by business intelligence services is measurable. BI-driven organizations reduce reporting cycle times by up to 70%, cut data preparation effort by 80%, and see a median ROI of 1,300% over three years according to Nucleus Research. KPI dashboards that update in real time replace the manual effort of compiling weekly reports freeing your analysts to focus on interpretation, not data wrangling.
BI Dashboard Development Services We Offer
Power BI Dashboard Development & Microsoft 365 Integration
Microsoft Power BI remains the market leader in self-service BI, used by 97% of Fortune 500 companies. Our Power BI consulting team designs custom dashboards for finance, sales pipeline management, operations monitoring, and executive reporting. We integrate Power BI directly with your Microsoft 365 ecosystem SharePoint, Teams, Azure, and Dynamics 365 so your KPI dashboard is embedded where your team already works.
For organizations comparing licensing options, our Power BI consulting practice covers Pro, Premium Per User (PPU), and Embedded configurations. We also offer predictive analytics solutions layered on top of your Power BI environment, enabling forward-looking forecasts directly inside your existing dashboards.
Tableau Dashboard Design and Embedded Analytics
Tableau remains the gold standard for data visualization services requiring complex, multi-dimensional analysis. Our Tableau dashboard design practice serves enterprises needing pixel-perfect visual storytelling, embedded analytics inside SaaS products, and high-performance dashboards across hundreds of concurrent users. We support Tableau Server, Tableau Cloud, and Tableau Embedded deployments, handling everything from data source optimization to governance and row-level security configuration.
Looker (Google) BI and LookML Modeling Services
For organizations on Google Cloud, Looker provides unmatched governance, reusability, and semantic layer consistency. Our LookML modeling services ensure your business logic lives in a single, versioned code layer not scattered across 200 individual reports. Looker’s API-first architecture also makes it the preferred choice for embedding business intelligence services inside customer-facing product experiences.
Qlik Sense: Associative Analytics for Discovery-Driven Teams
Qlik Sense’s associative engine surfaces relationships in your data that pre-defined queries miss entirely. It is the preferred platform for executive teams who need exploratory analytics without submitting IT tickets. Our Qlik implementations also cover migrations from legacy QlikView deployments. For organizations managing large-scale data infrastructure, we pair Qlik with our big data consulting services to ensure your pipelines support real-time BI workloads at scale.
Key Business Intelligence KPIs Your Dashboards Should Track
Effective business intelligence services are built around the right metrics not all available metrics. Our BI consulting team works with your stakeholders to define a KPI framework before a single dashboard is designed. Here are the high-value KPIs we implement across business functions:
|
Department |
Primary KPIs |
BI Tool Recommendation |
|
Sales & Revenue |
Pipeline Velocity, Win Rate, ARR Growth, ACV, Churn Rate |
Power BI + CRM connector |
|
Marketing |
CAC, ROAS, MQL-to-SQL Rate, LTV:CAC Ratio, Attribution |
Tableau / Looker |
|
Operations |
OEE, Throughput, Defect Rate, Cycle Time, On-Time Delivery |
Power BI Embedded |
|
Finance |
Gross Margin, Burn Rate, Cash Runway, AP/AR Aging, Budget vs. Actuals |
Power BI + Azure |
|
Customer Success |
NPS, CSAT, Ticket Resolution Time, Churn Risk Score |
Looker + CRM data |
Our BI Implementation Process
Our business intelligence consulting engagements follow a structured five-phase delivery model that has been refined across 80+ BI projects in finance, healthcare, retail, and manufacturing:
Phase 1 Discovery & Stakeholder Mapping
We conduct structured interviews with business stakeholders across departments to map decision needs to data availability. The output is a signed-off analytics brief with KPI definitions, data ownership, and prioritized dashboard list.
Phase 2 Data Source Audit & Connectivity Architecture
We audit every data source in your ecosystem CRM, ERP, cloud warehouses, marketing platforms, and operational systems and design an integration architecture that ensures your BI tool receives clean, timely, and consistent data. This phase often surfaces data quality issues that have silently distorted existing reports for months.
Phase 3 Data Modeling & Semantic Layer
This is where most BI implementations fail when done without expertise. Our team builds a clean semantic layer in DAX, LookML, or a dbt model so every dashboard across your organization uses the same metric definitions. No more ‘my numbers don’t match yours’ moments in board meetings.
Phase 4 Dashboard Design, User Testing & Iteration
We design dashboards with mobile-first principles for executive consumption and data-density optimization for analyst-level exploration. Every dashboard undergoes two rounds of user testing before deployment, with iterative refinement based on actual usage patterns.
Phase 5 Training, Adoption & Ongoing Support
Self-service BI only delivers ROI if your team actually uses it. We provide role-based training for business users, analysts, and administrators covering report building, data exploration, and governance best practices. Post-launch, our managed data analytics services pricing retainers include dashboard maintenance, model updates, and quarterly BI performance reviews.
Why Choose TheCoderBox for Business Intelligence Services?
|
Capability |
What We Deliver |
Business Outcome |
|
Full-Stack BI |
From data pipeline to live KPI dashboard end-to-end |
Single vendor accountability |
|
Tool-Agnostic |
Power BI, Tableau, Looker, Qlik, or mixed environments |
No platform lock-in |
|
Industry Expertise |
Finance, Healthcare, Retail, Manufacturing specialists |
Faster time-to-value |
|
Data Governance |
Security, RLS, GDPR/CCPA compliance built-in |
Audit-ready analytics |
|
Offshore Efficiency |
India-based BI team: save 50–60% vs onshore rates |
More BI for less budget |
For enterprise-scale engagements, our industry-specific analytics teams bring domain knowledge that generic BI consultancies cannot match whether that is HIPAA-compliant healthcare dashboards, FCA-aligned financial reporting, or retail demand-sensing dashboards connected to live POS data.
If you are evaluating team models, our dedicated offshore option through our hire data analytics consultant service gives you a full-time senior BI developer at a fraction of the onshore cost with full IP ownership, daily standups, and TheCoderBox quality assurance.
Book a Free BI Audit Identify the Gaps in Your Current Dashboards
|
Free BI Audit What You Get: 1-hour discovery session with a senior BI consultant. Review of your current dashboards, data sources, and KPI framework. Written gap analysis report with prioritized recommendations. Indicative project scope and investment estimate no obligation. |
Ready to transform your reporting stack? Contact TheCoderBox today to book your free business intelligence services audit. Our team responds within one business day.


